SECONDMENT
SYNTHESIS AND CHARACTERIZATION OF PR3+-YB3+ CO-DOPED GLASSES FOR THERMAL SENSING
FROM : UNIVERSIDADE DE AVEIRO (PORTUGAL)TO : UNIVERSIDADE ESTADUAL PAULISTA (BRASIL)
FROM : 9 AUGUST 2021 TO : 12 SEPTEMBER 2021
Involved Work Packages :
![]()
RESEARCHER
OBJECTIVES
By looking at the energy level diagram of different trivalent lanthanide ions (Ln3+), praseodymium (Pr3+) stands out because their intraconfigurational f-f transitions may occur through different pathways, giving rise to light emission in the blue, green, orange, red, and infrared spectral regions. Furthermore, materials containing both Pr3+ and ytterbium (Yb3+) can also be used to convert low-energy infrared radiation to high-energy light emission in a process known as upconversion. For that reason, Pr3+ and Yb3+ are usually embedded into glass matrices to design new devices for several optical applications. Among the myriad of matrices available, the use of phosphate glasses is attractive due to their low melting temperatures, high thermal expansion coefficient, and high solubility of Ln3+. In this way, this secondment aims the preparation of Pr3+-Yb3+ co-doped phosphate glasses to study the luminescent properties for thermal sensing through luminescence thermometry.
TASKS
- Preparation of luminescent phosphate glasses
- Preliminary optical characterization
RESULTS
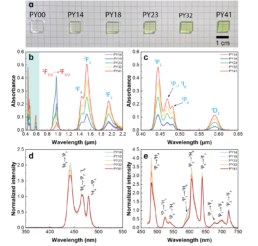
Lithium phosphate (LiPO3), yttrium fluoride (YF3), strontium fluoride (SrF2), and calcium fluoride (CaF2) were used to prepare phosphate glasses (LYSC) through the melt-quenching method. Different contents of trivalent praseodymium (Pr3+) and ytterbium (Yb3+) ions were incorporated in the glass samples by adding praseodymium oxide (Pr2O7) and ytterbium oxide (Yb2O3) into the glass matrix in order to achieve the characteristic luminescent properties of Pr3+ and Yb3+. Bulk glasses were obtained with the content of Pr3+ and Yb3+ varying between 0-1 mol% and 0-2 mol%, respectively. The preliminary optical characterization was performed through UV-Vis-NIR and photoluminescence spectroscopy, as shown in Figure 1.

